Evolution Lab
Background: Strawfish Prelab
For the Strawfish lab test, twenty yellow straws and twenty blue straws were placed in an opaque paper bag. At random, two straws were pulled out at a time. Two yellow straws symbolized the alleles for a yellow fish, two blue straws sybolized the alleles for a blue fish, and one yellow and one blue straws symbolized the alleles for a green fish. Therefore, the color of the fish is an example of incomplete dominance: rather than either the blue or yellow straws being dominant over the other, the presence of both colors created the blended green result.
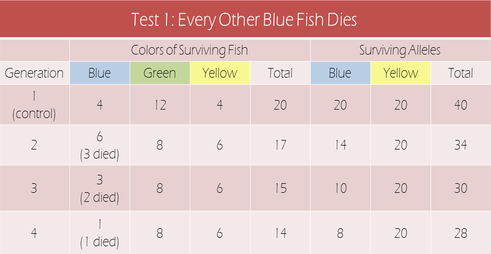
For the first test, the first generation served as the control, and all fish survived. However, for the subsequent generations, every other blue fish drawn (ie two blue straws or "alleles") died. The dead blue fishes' alleles were not returned to the bag for the succeeding generations. As a result, the number of blue alleles in the population gradually decreased, as did the number of blue fish.
For the first test, the first generation served as the control, and all fish survived. However, for the subsequent generations, every other blue fish drawn (ie two blue straws or "alleles") died. The dead blue fishes' alleles were not returned to the bag for the succeeding generations. As a result, the number of blue alleles in the population gradually decreased, as did the number of blue fish.
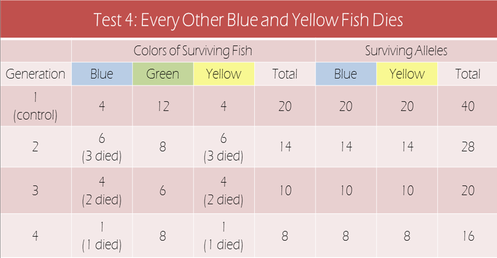
As for the fourth test, the first generation served as the control, and all fish
survived. However, for the subsequent generations, every other blue fish and yellow fish drawn (ie two blue straws or two yellow straws) died. The dead blue and yellow fishes' alleles were not returned to the bag for the succeeding generations. As a result, the number of blue and yellow alleles in the population decreased equally.
survived. However, for the subsequent generations, every other blue fish and yellow fish drawn (ie two blue straws or two yellow straws) died. The dead blue and yellow fishes' alleles were not returned to the bag for the succeeding generations. As a result, the number of blue and yellow alleles in the population decreased equally.

2. Did the allele frequency change much over the 4 generations in this test? Explain.
For Test #1, the blue allele frequency decreased from the initial 50% in Generation 1 to 41% in Generation 2, 33% in Generation 3, and 29% in Generation 4. Therefore, the yellow allele frequency increased accordingly throughout the generations; the yellow allele population increased from the initial 50% in Generation 1 to 59% in Generation 2, 67% in Generation 3, and 71% in Generation 4. This occured because the blue alleles were being removed from the population but the yellow alleles were not.
For Test #4, the allele frequency for both the yellow and blue alleles remained constant because the alleles were being removed from the population at an equal rate (because both the yellow and blue fish were being preyed upon).
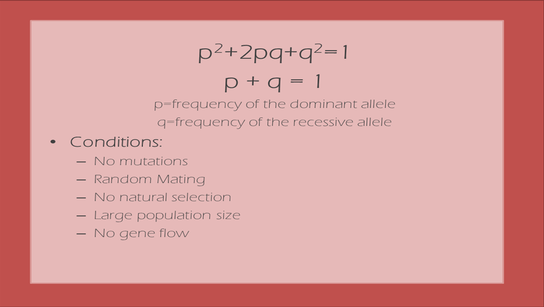
Hardy-Weinburg Equation
Evolution Lab: Procedure
Case 1: Test of an Ideal Hardy-Weinberg Population
The class represents a breeding population. Each student will choose another student at random to simulate random mating, The class is a population of randomly mating heterozygous individuals with an initial gene frequency of p=.5 and q=.5.
The initial genotype frequencies are AA=.25, Aa=.50, and aa=.25.
Every student will be given 2 cards that act as gametes. One card is the dominant A while the other is the recessive a. When two students "mate," each will randomly select one of their two initial cards. The combination is the genotype of the succeeding generation. The students then assume the genotype of the produced generation and continue "mating" with other students, following the same procedure each round. Record each generation in a data table.
For the second case, all of the aa children die. Therefore, when mating, if an aa is produced, continue "breeding" until either an Aa or AA is produced. Record each generation in a data table.
Results / Conclusions
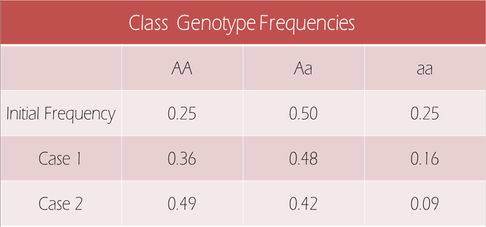
Why did our case 1 data not match the initial HW?
In order for the Hardy-Weinburg principle to be applicable, the population must coincide with five conditions- no mutations, random mating, no natural selection, large population size, and no gene flow. In our class, there were no mutations, there was random mating, there was no population, and there was no gene flow. However, the population size is very small - only about thirty students. Therefore, the Hardy-Weinburg principle cannot be expected to be entirely accurate. If more students were "mated" - ie, if other classes were also involved, the results of Case 1 would more closely match the initial frequencies.
Sources of Error
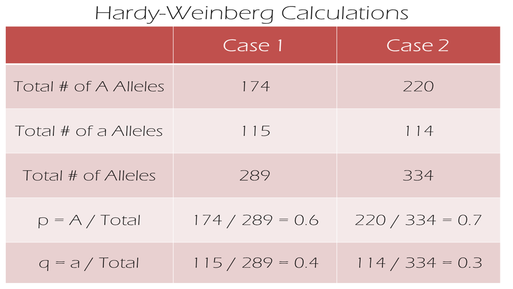
One major source of error was faulty reporting. In case one, 289 alleles were reported. Considering that this is not even a multiple of twelve, the number of alleles every student was supposed to report, the alleles must not have been counted or reported entirely correctly. Miraculously, the number of alleles reported in Case 2 jumped to 334 - still not a multiple of twelve! This affected the Hardy-Weinburg calculations and, if the source of error was eliminated in Case 1, the results may have more closely matched the initial frequencies.
In order for the Hardy-Weinburg principle to be applicable, the population must coincide with five conditions- no mutations, random mating, no natural selection, large population size, and no gene flow. In our class, there were no mutations, there was random mating, there was no population, and there was no gene flow. However, the population size is very small - only about thirty students. Therefore, the Hardy-Weinburg principle cannot be expected to be entirely accurate. If more students were "mated" - ie, if other classes were also involved, the results of Case 1 would more closely match the initial frequencies.
Sources of Error
One major source of error was faulty reporting. In case one, 289 alleles were reported. Considering that this is not even a multiple of twelve, the number of alleles every student was supposed to report, the alleles must not have been counted or reported entirely correctly. Miraculously, the number of alleles reported in Case 2 jumped to 334 - still not a multiple of twelve! This affected the Hardy-Weinburg calculations and, if the source of error was eliminated in Case 1, the results may have more closely matched the initial frequencies.